Data flows can be documented at different levels of detail: Subject Area, business entity, or even the attribute level. Systems can be represented by network segments, platforms, common application sets, or individual servers. Data flows can be represented by two-dimensional matrices (last week's figure) or in data flow diagrams (this figure).
A matrix gives a clear overview of what data the processes create and use. The benefits of showing the data requirements in a matrix is that it takes into consideration that data does not flow in only one direction; the data exchange between processes are many-to-many in a quite complex way, where any data may appear anywhere. In addition, a matrix can be used to clarify the processes' data acquisition responsibilities and the data dependencies between the processes, which in turn improves the process documentation. Those who prefer working with business capabilities could show this in the same way - just exchanging the processes axis to capabilities. Building such matrices is a long-standing practice in enterprise modeling. IBM introduced this practice in its Business Systems Planning (BSP) method. James Martin later popularized it in his Information Systems Planning (ISP) method during the 1980s.
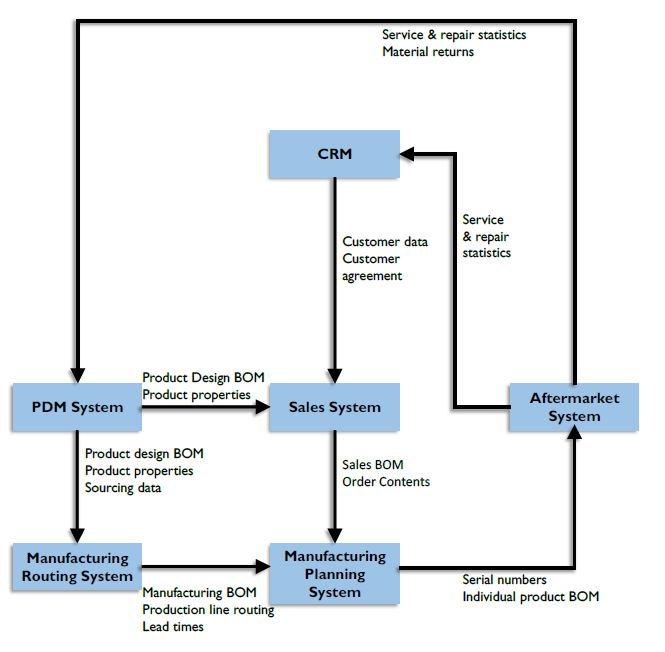
The data flow in this figure is a traditional high-level data flow diagram depicting what kind of data flows between systems. Such diagrams can be described in many formats and detail levels.